FluoroMerch
Mechanics informed fluoroscopy of esophageal transport
Overview
- Fluoroscopy is a radiographic procedure for evaluating esophageal disorders such as achalasia, dysphasia and gastroesophageal reflux disease (GERD). It performs dynamic imaging of the swallowing process and provides anatomical detail, and a qualitative idea of how well swallowed fluid is transported through the esophagus.
- In this work, we present a method called mechanics informed fluoroscopy (FluoroMech) that derives patient-specific quantitative information about esophageal function. FluoroMech uses a Convolutional Neural Network to perform segmentation of image sequences generated from the fluoroscopy, and the segmented images become input to a one-dimensional model that predicts the flow rate and pressure distribution in fluid transported through the esophagus.
- We have extended this model to identify and estimate potential physio-markers such as esophageal wall stiffness and active relaxation ahead of the peristaltic wave in the esophageal musculature. FluoroMech requires minimal computational time, and hence can potentially be applied clinically in the diagnosis of esophageal disorders.
Extracting Bolus Geometry from Fluoroscopy Using Deep Learning Techniques
Predicted Flow Rate and Pressure
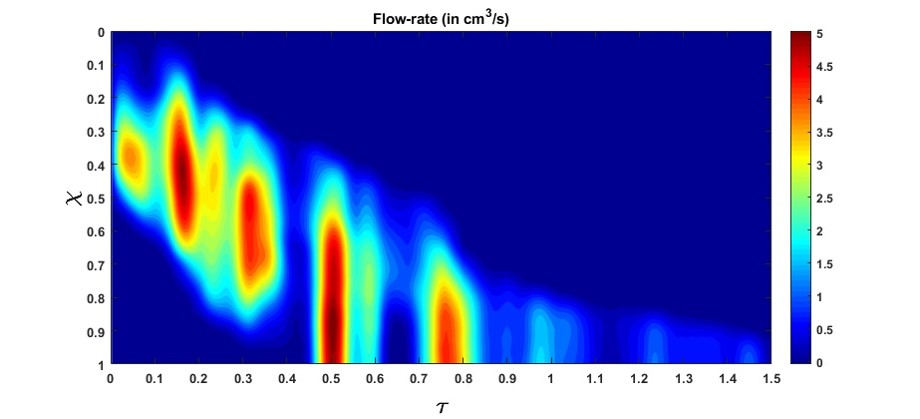
Flow rate within the esophagus. The high flow rate at τ = 0.5 marks the start of emptying
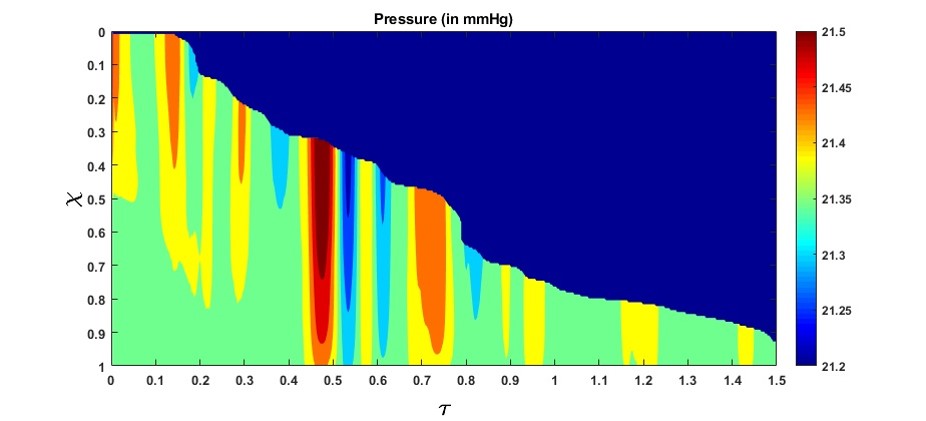
Fluid pressure within the esophagus. The high-pressure gradient near τ = 0.5 shows the LES requires a high-pressure gradient to allow fluid to pass through it. The dynamic pressure variations are significantly small compared to the static pressure inside the esophagus
Stiffness and Active Relaxation
Variation of minimum stiffness (in mmHg) along the length of the esophagus.
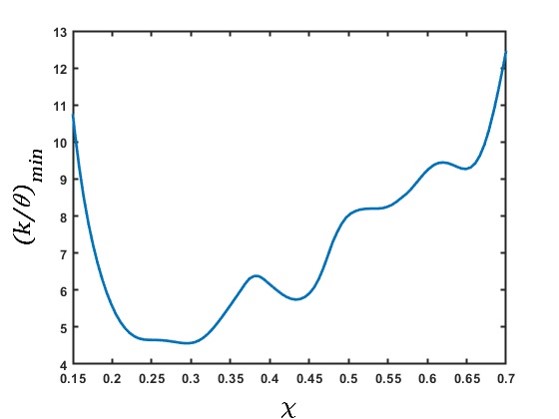
This measure of stiffness incorporates the effect of active relaxation; therefore, its low values correspond to the high values of cross-sectional areas. The predicted high stiffness at χ = 0.15 and 0.7 is due to the influence of the peristaltic contraction and the LES, respectively.
Variation of the maximum active relaxation factor.
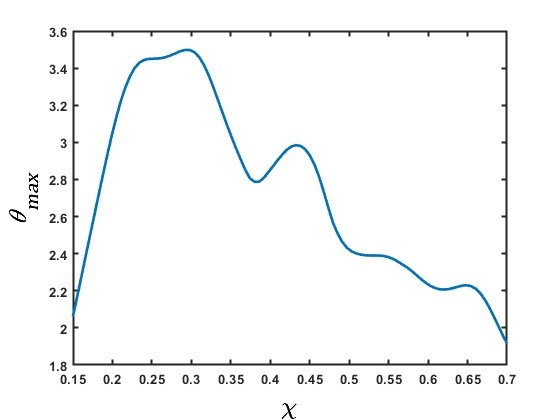
The high values of θ_maxcorrespond to the low values of stiffness. The low values of θ_max at the χ = 0.15 and 0.7 are due to the influence of the peristaltic contraction and the LES, respectively.