FLIP-MECH
In silico modeling enables exploring physiological conditions that are otherwise not possible. An example is presented here.
Video on the left shows a peristaltic activation wave traveling over a bolus. Only longitudinal muscle contraction is activated. Clearly, bolus transport is absent and esophageal emptying is impaired. |
|
Video on the right shows the same peristaltic activation wave now acting on all the muscle layers of the esophagus. Circular muscle contraction now forces the bolus to move forward and eventually leads to complete bolus emptying. Colors show solid stresses within the esophageal wall. |
This animation clearly demonstrates that circular muscle layer contraction is of paramount importance for normal esophageal function.
FLIP Pumping Patterns
The 1D mathematical model developed for the FLIP reveals four distinct pumping patterns during peristalsis
Scenario 2 is most common and occurs during normal peristalsis. The contraction is able to move fluid from the proximal to the distal part of the bag thus indicating healthy esophageal transport.
Scenario 3 occurs when the fluid inside the bag is extremely viscous. This parameter setting is similar to that observed during ingestion of food. The bolus (which is extremely viscous) forms a ball ahead of the contraction as it travels down along the esophagus.
Scenario 4 indicates very weak peristalsis. The contraction strength is so low that the wave is imperceptible as it travels over the FLIP bag.
Thus mathematical modeling of the FLIP device reveals various modes of operation that might be observed during the procedure
Visualizing Pumping Patterns on a Regime Map
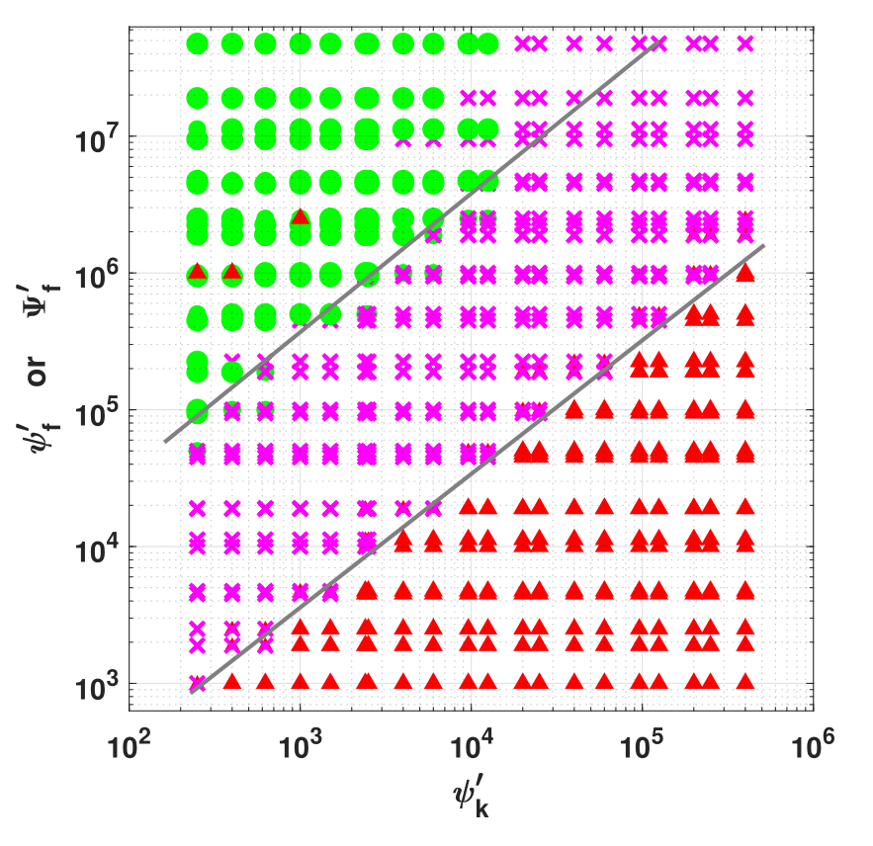 |
This figure shows which pumping pattern might be observed depending on the operating conditions of the device. The horizontal axis represents the esophagus+FLIP system’s cumulative stiffness. The vertical axis represents its cumulative resistance to fluid flow. Legend:
|
EndoFLIP 3D Fluid-Structure Interaction Simulations
This video shows the results of a fully-resolved 3D simulation of the EndoFLIP device as a peristaltic wave travels over it.
The plot on the left shows the variation of fluid velocity inside the FLIP bag during peristalsis.
The plot on the right shows the variation of pressure inside the bag due to the contraction wave.
Clearly, pressure is not uniform in the bag. This was one of the key insights from the mathematical model of the FLIP. These simulations strongly suggests that the addition of a proximal sensor to the FLIP might be beneficial to relate pressure differences observed to the strength and speed of the contraction